Basic HTML Version


27
Mineralization of human carotids,
Agnieszka Bieniek et al.
www.angiologia.pl
means of this, the atomic structure of the examined
phases can be recognized [1, 10]. Infrared Absorption
Spectroscopy examination consists of the measurement
of infrared light wave absorption by the ground sample
and the sample mixed with KBr, and the measurement
of clear KBr preparation. Both materials were formed
in tablet shape. IR method was used for 10 samples. In
order to more accurately identify the hydroxyl groups
one of the samples was prepared by IR method in two
ways. The first of the tablets was prepared by direct
grinding of the sample with KBr, while the second one
was made from a sample that was dried in 140
°
C within
3 hours and then ground with KBr. In this way hydra-
tion water was removed from the sample. To conduct
these analyses Infrared Fourier Spectroscopy (BIO-RAD
production, FTS 165 model) was employed.
Results
Mineral grains were observed in 13 of 26 sam-
ples. Scanning microscope observation allowed us to
deduce that mineralization of carotids manifests in the
form of mineral-organic agglomerations. At the site of
inorganic formations, identified as calcium phosphate,
no distinct crystalline formations are observed (Figure 5).
Objects of this kind appear in lumpy form (Figure 6) and
very rarely in plate form (Figure 7). Organic mineraliza-
tion is observed as mixed forms along with inorganic
mineralization. Both elements stay in an unstable ratio. In
some samples, organic formations exist as characteristic
needle agglomerations (Figure 8). Chemical analyses that
were carried out in the EDS system proved the existence
of calcium and phosphate in sclerosis lodgement (Figures
9–14). In some energetic spectra of the examined sam-
ples, some vestigial quantities of other elements were
also revealed (sodium, magnesium, sulphur).
X-ray diffraction analysis indicate on the presence
of apalite in the examined material. The inter-plane dis-
tances marked at the diffraction graphs (Figures 15 and
16) are characteristic for two mineral phases: hydroxy-
lapatite and fluorapatite. All X-ray photographs have
peaks the height and width of which indicate the poor
grade of internal structure arrangement of the identified
mineral phases.
Spectra received from IR method in examined sam-
ples indicate PO
4
3–
groups, organic material, and hydroxyl
groups (Figures 17–19). The most intensive absorbing
bands come from the phosphate group and their maxima
vary between 1035 and 1040 cm
–1
. The bands at 471.468–
–962.6 cm
–1
also give evidence of PO
4
3–
presence. The
organic material in the examined samples is represented
by phospholipids and cholesterol. The peaks at 1235.76–
–1508.7 cm
–1
and 2861.12–2931.85 cm
–1
absorbing lines
złogi miażdżycowe, mineralno-organiczne, przechowy-
wane były w formalinie (ryc. 1–4). W 13 z 26 próbek za-
obserwowano ziarna mineralne. Z uzyskanego materiału
wyseparowano kryształki za pomocą skalpela i pincety,
a następnie wysuszono. Uzyskane ziarna mineralne miały
wielkość do 3 mm. Z tego powodu zrezygnowano z ba-
dań za pomocą mikroskopu polaryzacyjnego. Wykonano
badania metodą mikroskopii skaningowej (SEM) z mi-
kroanalizą EDS (
Energy Dispersive Spectroscope
), rentge-
nowskiej analizy dyfrakcyjnej (XRD) oraz spektroskopii
absorpcyjnej w podczerwieni (IR).
Metodę skaningowej mikroskopii elektronowej wy-
korzystano do obserwacji powierzchni morfologicznej
złogówmiażdżycowych. Obserwacjom poddano wyse-
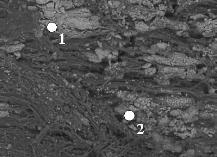
Figure 5.
Mineralization of a carotid. A 66-year-old man. SEM,
1000 × zoom. Points 1 and 2 indicate the places where EDS
analysis was carried out
Rycina 5.
Mineralizacja tętnicy szyjnej. Mężczyzna 66 lat. SEM,
powiększenie × 1000. Punkt 1 i 2 oznaczają miejsca wykonania
analizy EDS
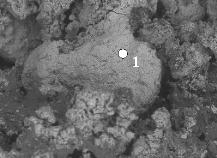
Figure 6.
Mineralization of a carotid. A 67-year-old woman.
SEM, 400 × zoom. Point 1 indicates the place where EDS
analysis was carried out
Rycina 6.
Mineralizacja tętnicy szyjnej. Kobieta 67 lat. SEM,
powiększenie × 400. Punkt 1 oznacza miejsce wykonania
analizy EDS