Basic HTML Version


29
Mineralization of human carotids,
Agnieszka Bieniek et al.
www.angiologia.pl
indicate organic formation presence whereas the bands at
1652.53–1658.16 cm
–1
and 3357.88–3418.21 cm
–1
show
saturation of the sample. The peaks of the absorbing lines
at 3357.88–3418.21 cm
–1
are very large bands and are due
to both water and hydroxyl groups. Infrared spectropho-
tometric analysis before drying (Figure 17) and after drying
(Figure 18) confirmthe fact that absorbing bands that come
from hydroxyl groups can indicate both the presence of
OH-groups and water absorbed superficially. During the
observation of spectroscopic spectra of the samples, the
movement of a wide band, originating from the water in
a dried sample, in the direction of lowerwave numberswas
noticed. This information can indicate stronger chemical
bonding in the sample before drying.
Discussion
Mineralization in a living body is a process that leads
to the enlargement or saturation of some structures in
zjawiska, wykonano także jakościowe analizy chemiczne
próbek w systemie EDS. Na wykresach widm EDS piki C
mogą być o podwyższonej intensywności ze względu
na wcześniejsze napylenie preparatów węglem. Duża
głębia ostrości mikroskopu skaningowego umożliwiła
obserwację morfologii badanych próbek. W badaniach
posłużono się mikroskopem skaningowym firmy FEI,
model QUANTA 200 FEG.
Rentgenowska analiza dyfrakcyjna jest metodą fa-
zową pozwalającą identyfikować minerały. Okazuje się
szczególnie przydatna dla substancji bardzo drobnokry-
stalicznych [1]. Tą metodą poddano badaniom 4 próbki
(pozostałe były zbyt małe). Ponieważ optymalna wiel-
kość krystalitów w analizie rentgenograficznej powinna
być rzędu 1 µm, ziarna uprzednio rozdrobniono. Badania
rentgenograficzne przeprowadzono, wykorzystując dy-
fraktometr rentgenowski APD X’PERT PW 3020 firmy
Phillips wyposażony wmonochromator refleksyjny gra-
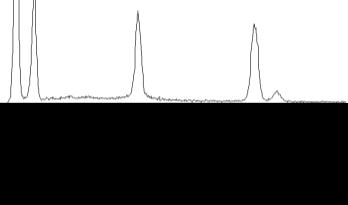
Figure 13.
Energetic EDS spectrum of the area marked in
Figure 8 (point 1). A 63-year-old man
Rycina 13.
Widmo energetyczne EDS obszaru zaznaczonego
na rycinie 8 (punkt 1). Mężczyzna 63 lata
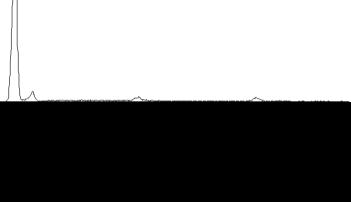
Figure 14.
Energetic EDS spectrum of the area marked in
Figure 8 (point 2). A 63-year-old man
Rycina 14.
Widmo energetyczne EDS obszaru zaznaczonego
na rycinie 8 (punkt 2). Mężczyzna 63 lata
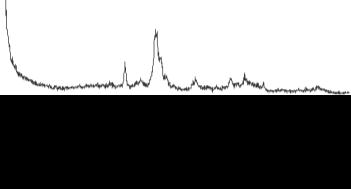
Figure 15.
X-ray diffraction graph of mineral grains of the
sclerosis lodgement removed from a carotid. A 62-year-old man
Rycina 15.
Dyfraktogramrentgenowski ziarenmineralnych złogu
miażdżycowego usuniętego z tętnicy szyjnej. Mężczyzna 62 lata
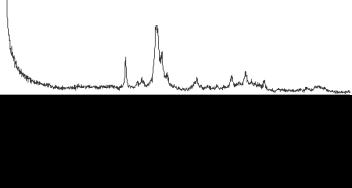
Figure 16.
X-ray diffraction graph of mineral grains of the
sclerosis lodgement removed from a carotid. A 66-year-old man
Rycina 16.
Dyfraktogramrentgenowski ziarenmineralnych złogu
miażdżycowego usuniętego z tętnicy szyjnej. Mężczyzna 66 lat